Generate a Power BI Dashboard from Microsoft Lists in Three Clicks with Construction Viz
Microsoft 365 Lists is a relatively new app that allows users to view and create interactive lists for managing items such as tasks, issues, and even assets for a construction project. If you have used Microsoft SharePoint Online, Lists will seem familiar since it uses the same list technology.
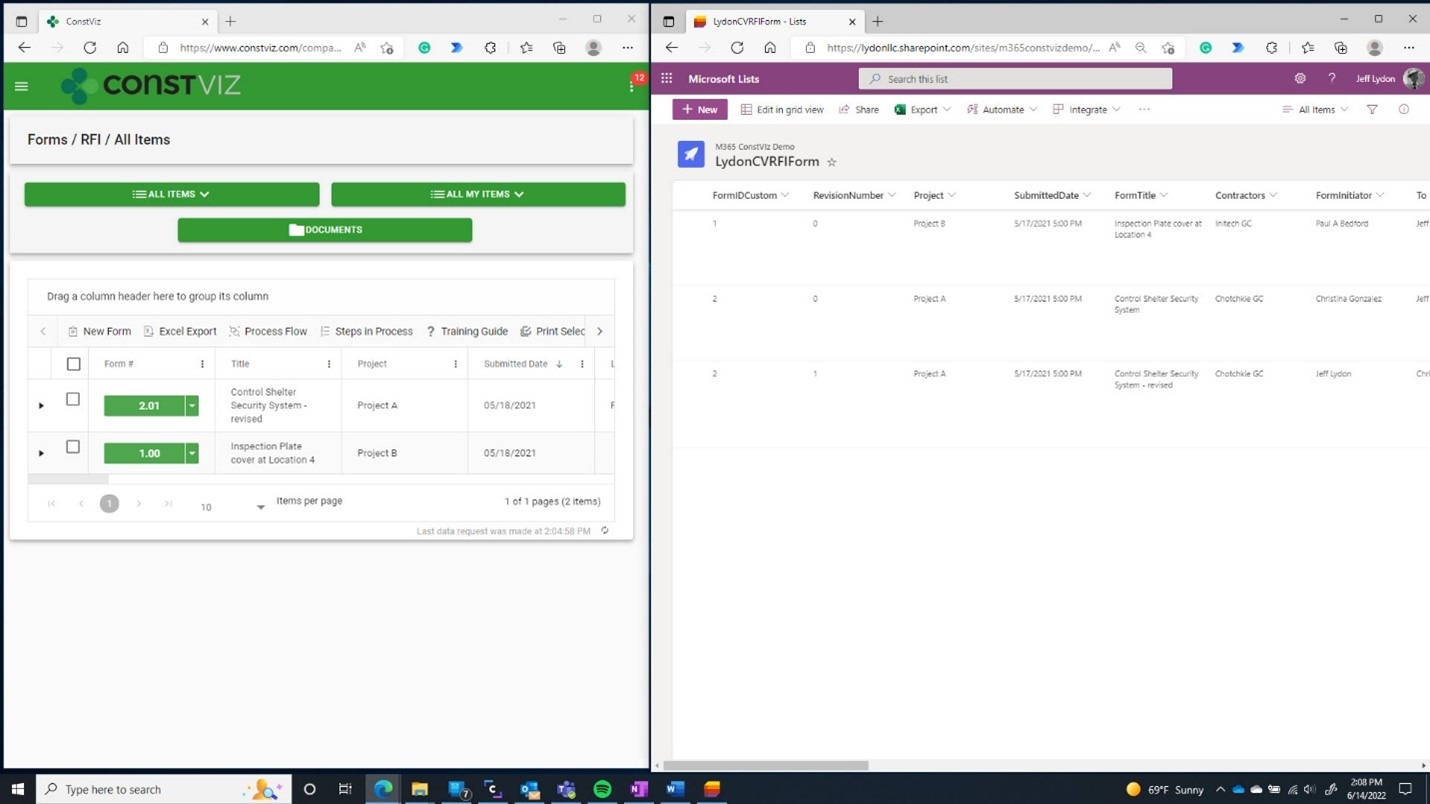
Construction Viz leverages SharePoint lists and libraries to store project data so you can be assured that it is always safe and available 24x7. And because both Microsoft Lists and Construction Viz both use SharePoint lists under the hood, you can interact with your lists in either application. For example, you can use Microsoft Lists to view, create reports, and interact with any of your lists without going into Construction Viz or SharePoint.

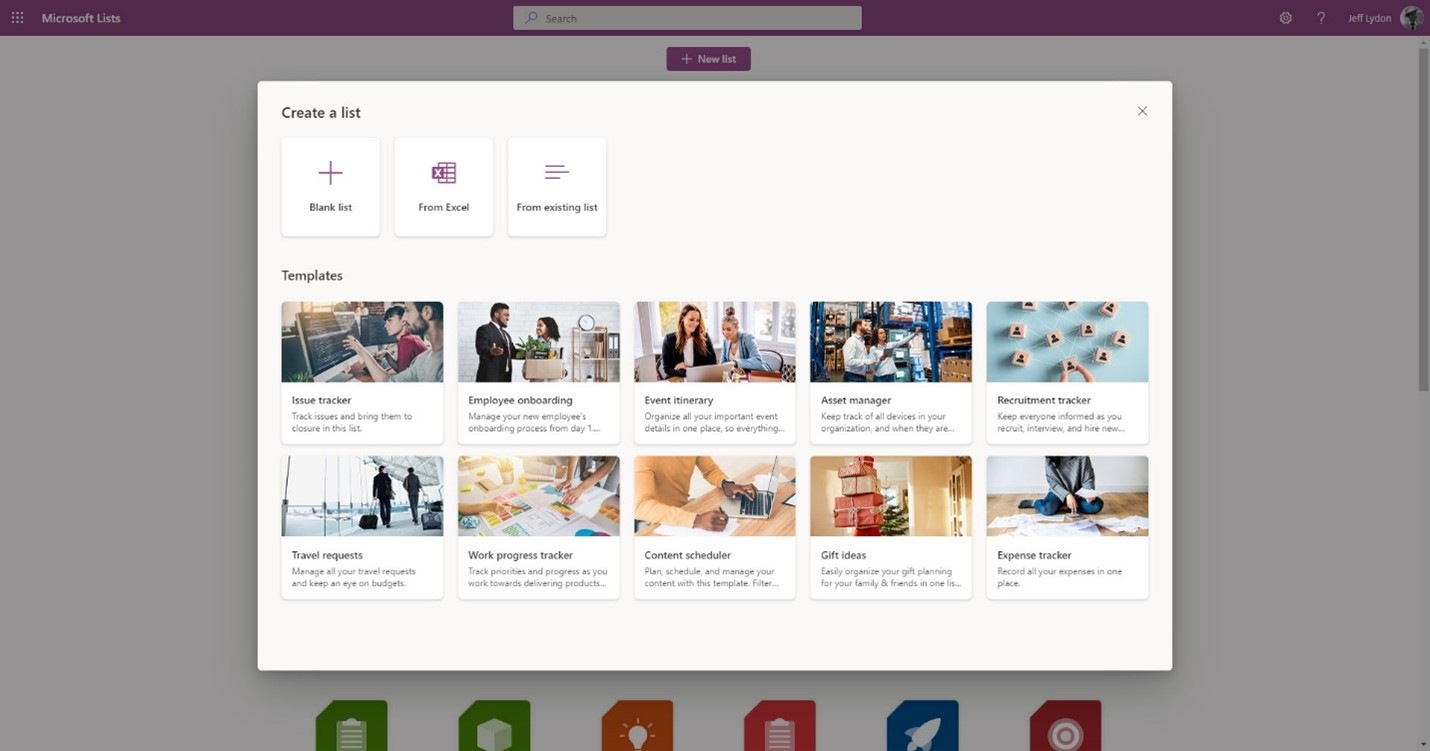
To access an existing Construction Viz SharePoint list from Microsoft Lists, click the new list button and select an existing Teams site or SharePoint site to find an available list.

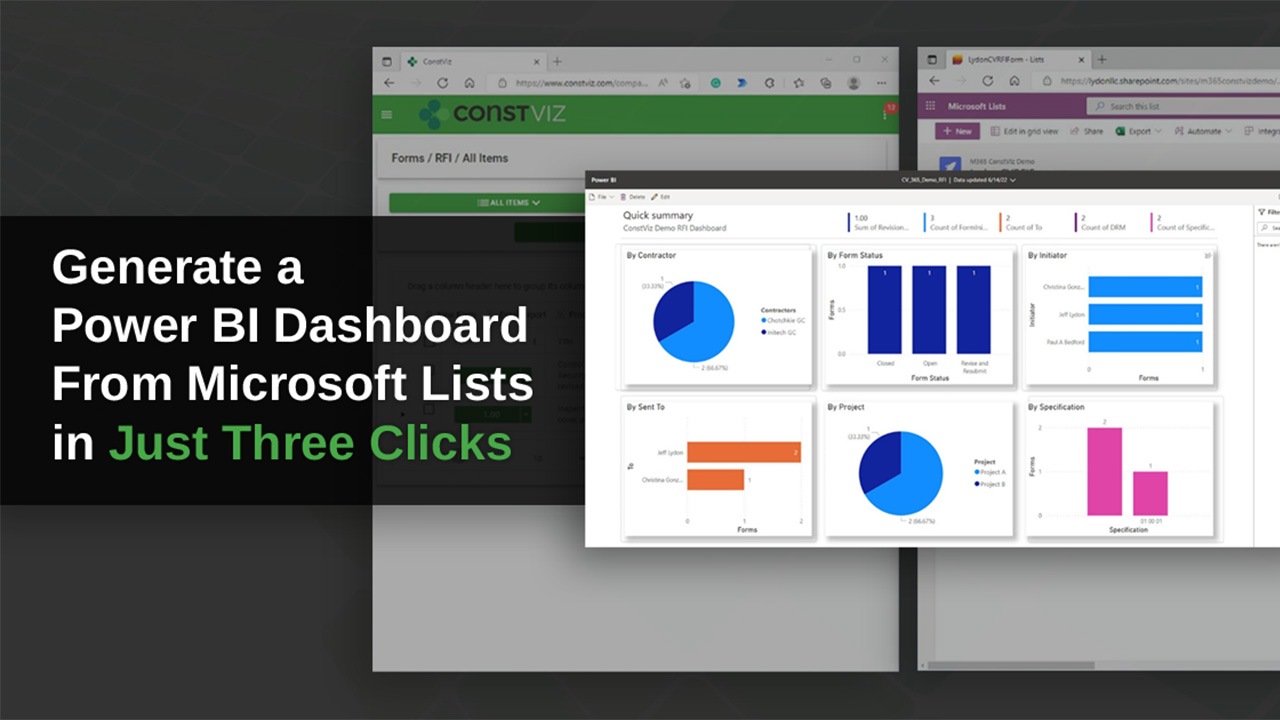
One of the great features of Microsoft Lists is its ability to quickly create a Power BI report from the list with as little as three clicks. From Microsoft Lists, if you click Integrate, select Power BI, and then Visualize the List, Power BI will assess all of your list data fields and automatically generate a configurable dashboard. With a few minor changes, you can quickly publish a powerful dashboard to report on the status of your list data, such as your Construction Viz RFI log.

This is just one of many integrations with Microsoft 365 services that Construction Viz can leverage.
You can request a demo of Construction Viz here to learn how to get the most out of your Microsoft 365 investment to manage your construction projects.

